The original Brewed Coffee Control Chart was designed by E.E. Lockhart a little over 60 years ago. Since then, coffee growing, roasting, grinding, and brewing technologies have all changed enormously, and yet the Coffee Control Chart has remained unchanged. To bring this important tool up to date, we started a project to re-design it — taking modern techniques and the latest research on the subject into account.
To kick this off, back in 2018 we initiated a survey for readers of our Advanced Coffee Making course, to find out what brew ratios were commonly used around the world for different brewing methods. Our intention was to build on the original Brewing Control Chart, and bring it up to date to include regional preferences, and the effects of modern equipment and techniques.
In particular, we wanted to establish common brew ratios for two less-studied brew methods: Ibrik, or Cezve; and the classic Moka Pot. We also wanted to see if there were regional differences in the brew ratios that baristas choose for different methods. Finally, we wanted to re-examine the long-standing ‘Gold Cup’ window for extraction of 18-22%, in the light of the equipment and brewing methods being used today.
The Original Chart
The original Brewing Control Chart was published in 1957 and established a standard for brewing filter coffee that is still widely taught and followed today. According to the chart, the ‘ideal’ filter coffee had Total Dissolved Solids (TDS) between 1.15 and 1.35%, and between 18 and 22% extraction.
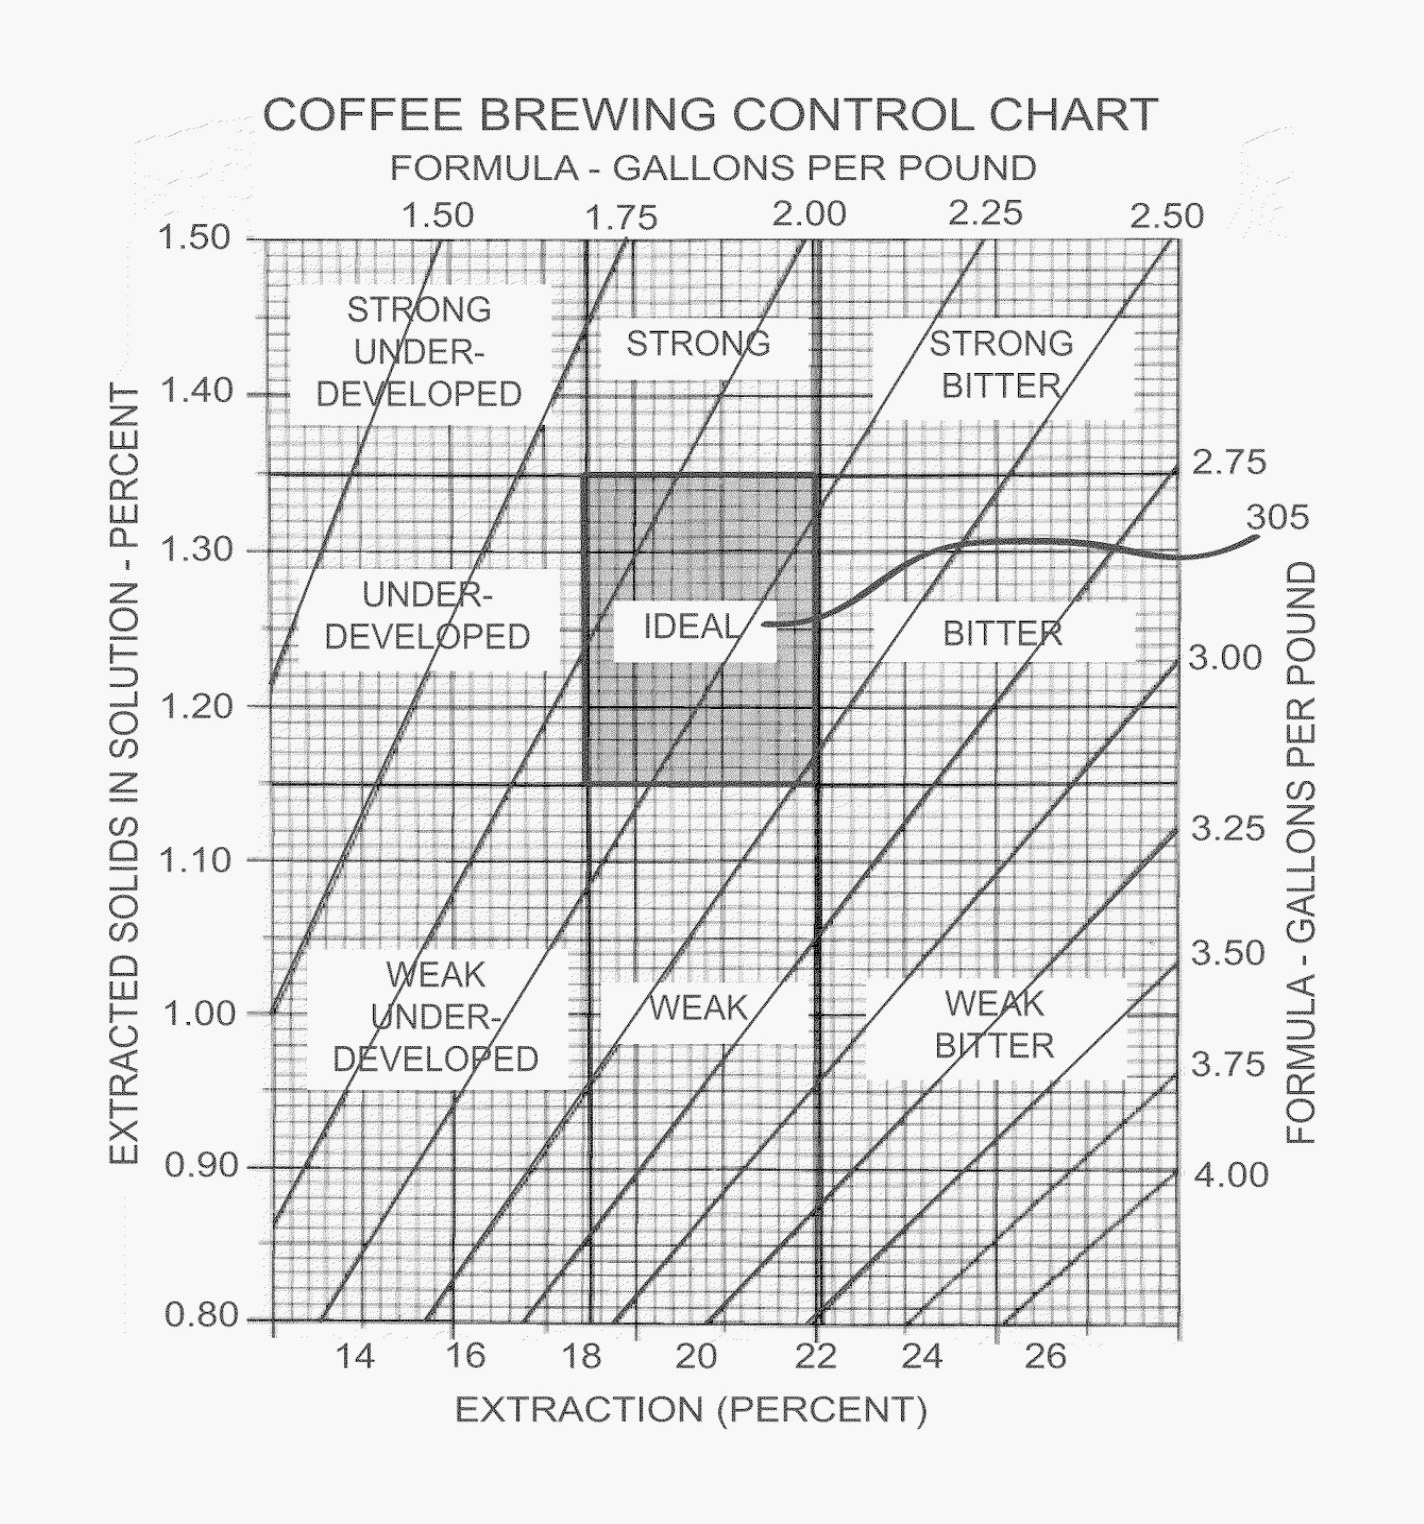 A Coffee Brewing Control Chart from 1959.
While this standard has remained unchanged for more than 60 years, very little research has emerged since then that confirms these findings. Furthermore, the way coffee is roasted and brewed has developed in the intervening years, and consumer preferences may also have changed over time. For this reason, researchers have recently been re-examining the brewing control chart to provide a better guide for coffee brewing.
What is an ‘Ideal’ Extraction?
Within specialty coffee circles, there has been a definite trend towards higher extractions in recent years, enabled by improvements in grinding equipment and brewing techniques. The main limit on how much coffee can be extracted in a brew is the development of dry, ashy, ‘over-extracted’ flavours. If coffee is extracted more evenly, then it is possible to achieve higher extractions without developing those negative flavours.
Since better equipment and techniques allow more even extraction, they also allow higher extractions. As a result, extractions well beyond the traditional limit of 22% are now commonplace, and the whole concept of ‘over-extraction’ is being challenged.
In 2013, the SCA published the European Extraction Preferences in Brewed Coffee (SCA 2013), which set out to check if Lockhart’s original 18-22% recommendation held up, when tested on today’s coffee consumers. They found a slight preference for extractions between 20-24%, suggesting that with modern grinders and brewers the ‘ideal’ window of extraction had moved slightly towards higher extractions.
 Consumer preferences for coffee at different extraction levels, but to the same strength. In general, consumers preferred coffee extracted to 22%. Source: European Extraction Preferences in Brewed Coffee (SCA 2013).
The SCA researchers point out that the difference in preferences for different extraction levels are pretty small, considering how widely the idea of an ‘ideal’ extraction range is taught. They also saw some differences in the preferences of consumers from different regions — for example, in Milan, consumers overwhelmingly preferred the highest extraction level. The researchers speculated this was because Milanese coffee drinkers are more used to drinking espresso, and hence preferred the more intense flavours of high extractions.
More recent research, however, throws the whole idea of an ‘ideal’ extraction range into question. A series of studies by scientists at the UC Davis Coffee Center tested brews of varying extractions and strengths on coffee consumers. They found weak support for the idea that an ideal range for brewed coffee lies in the centre of the Brewing Control Chart, with the most preferred brews having 19-24% extraction and 1.1-1.3% TDS (Cotter et al 2020).
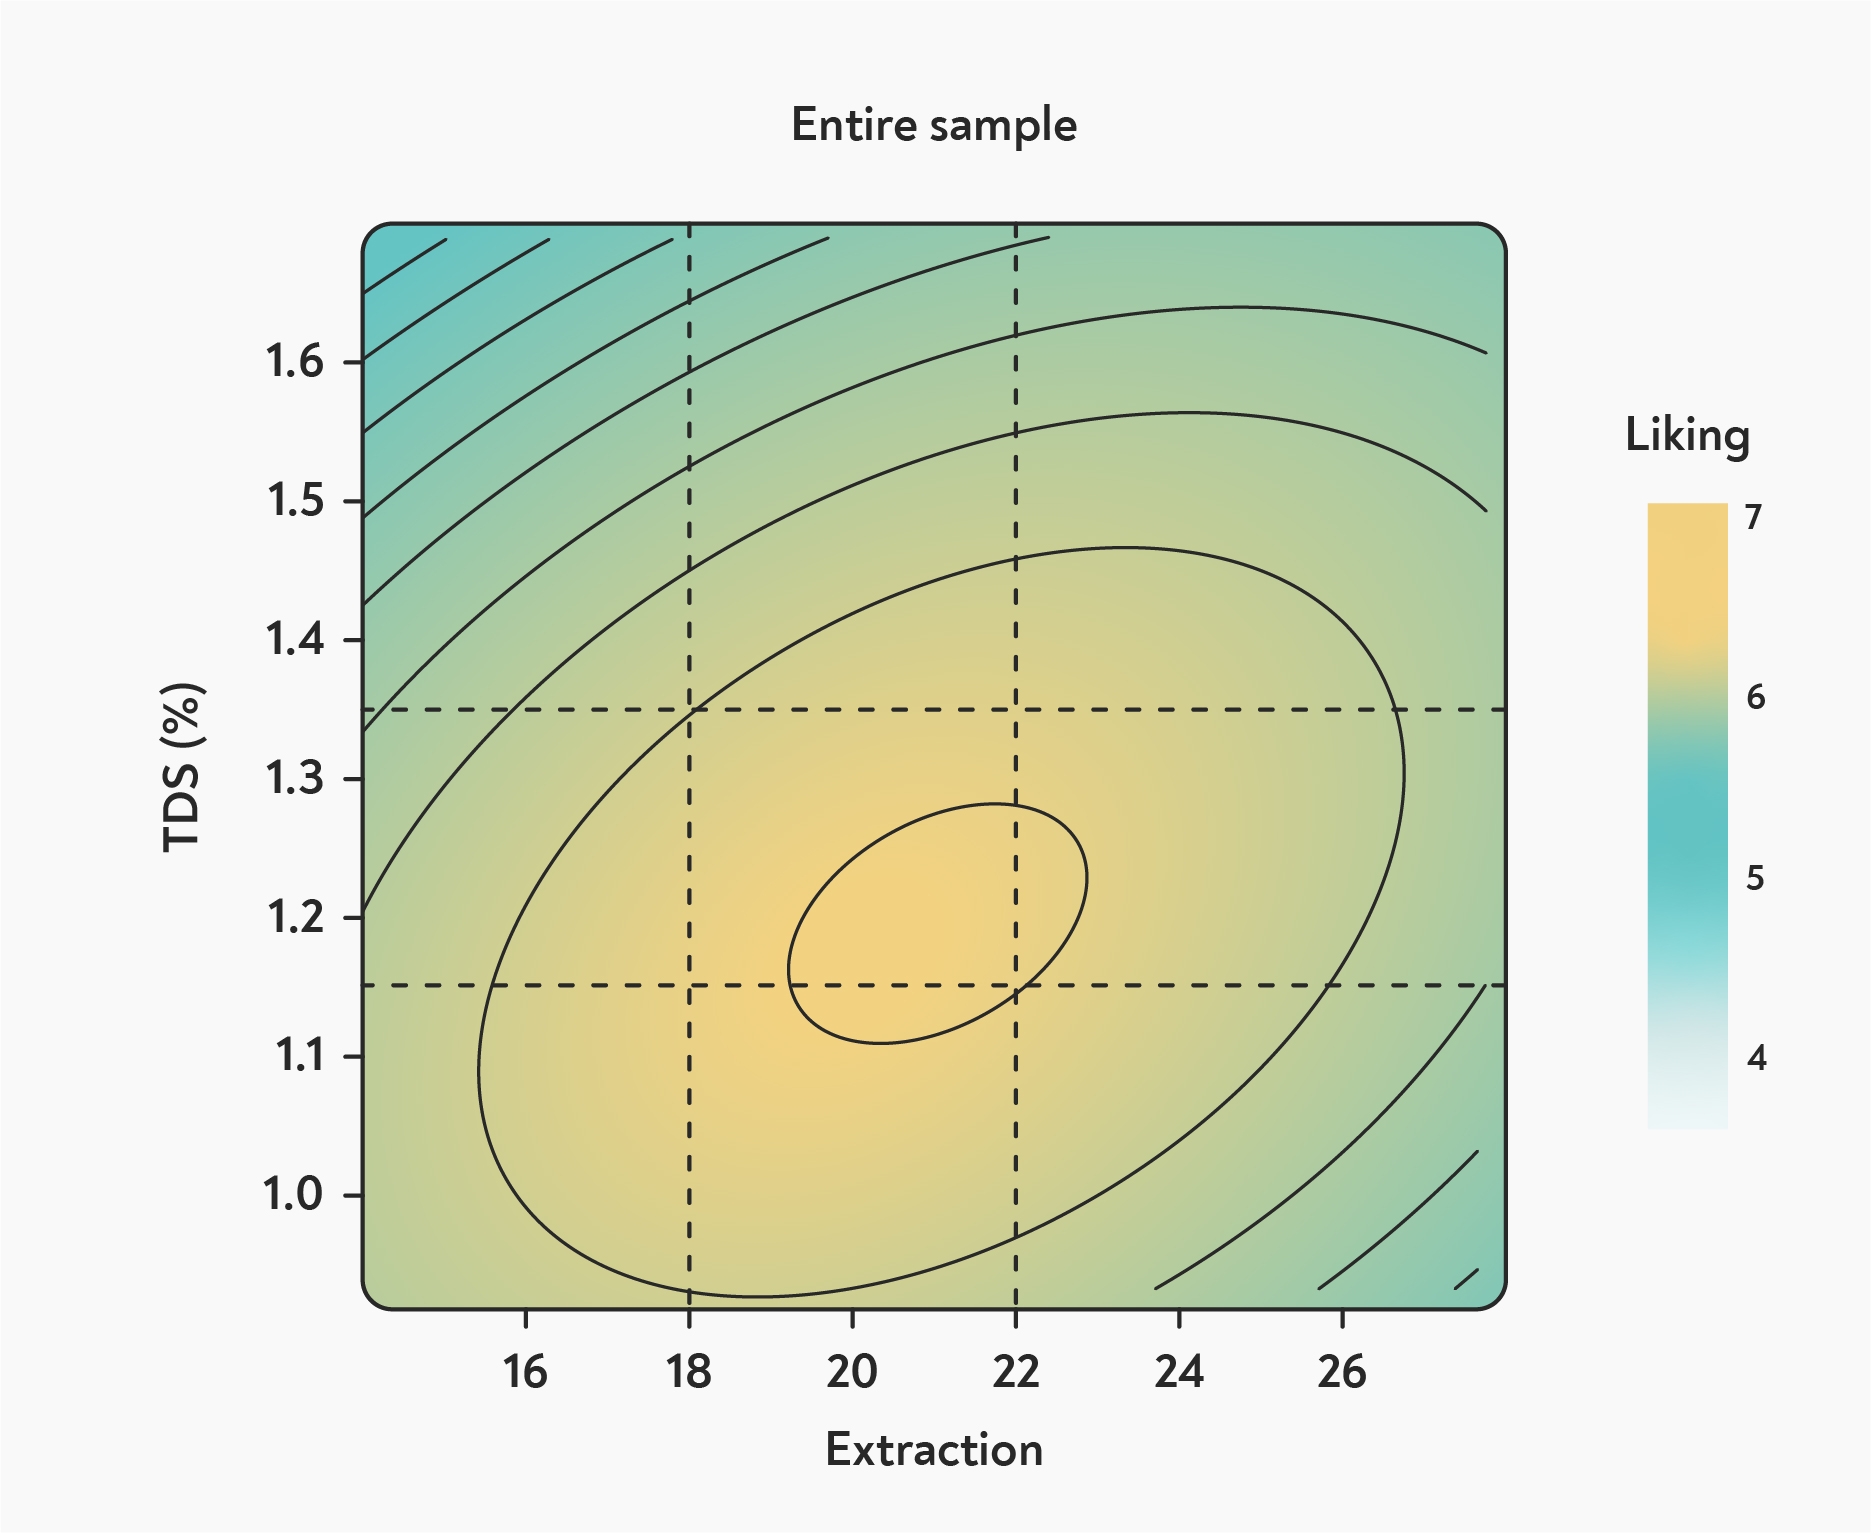 Consumer preferences for brewed coffee. The researchers caution that this average doesn’t accurately reflect true consumer preferences, which fall into two distinct groups. Source: Cotter et al 2020.
This overall picture, however, hides a much more complex pattern of preferences hidden within the data. The scientists found that the consumers in their study fell into two more or less equally-sized groups. People in the first group (Cluster 1) tended to prefer stronger brews, and were more likely to enjoy high acidity coffees; while people in the second group (Cluster 2) preferred weaker brews with lower acidity.
Interestingly, a survey on their demographics and coffee drinking preferences found no other differences between the two groups. They were similar in gender, age, and ethnicity. They drank similar amounts of coffee, were just as likely to drink black coffee, and had similar preferences for light or dark roasts, and were both equally likely to frequent Starbucks or the local coffee shop.
The two groups also had surprisingly different extraction preferences. People in Cluster 2 had a preference for low to medium extractions, consistent with the idea of an ideal extraction range close to the centre of the Coffee Control Chart. Consumers in Cluster 1, however, didn’t have a single preferred range, but instead preferred brews at both extremes. This preference calls to mind the concept of the ‘Double Hump’, an idea, first suggested by Scott Rao, that proposes that for a given coffee there are not one but two ‘sweet spots’ for extraction, with lower-quality brews found in the middle. The researchers, meanwhile, suggest that consumers in this group may be specifically drawn to coffees with particularly extreme flavours.
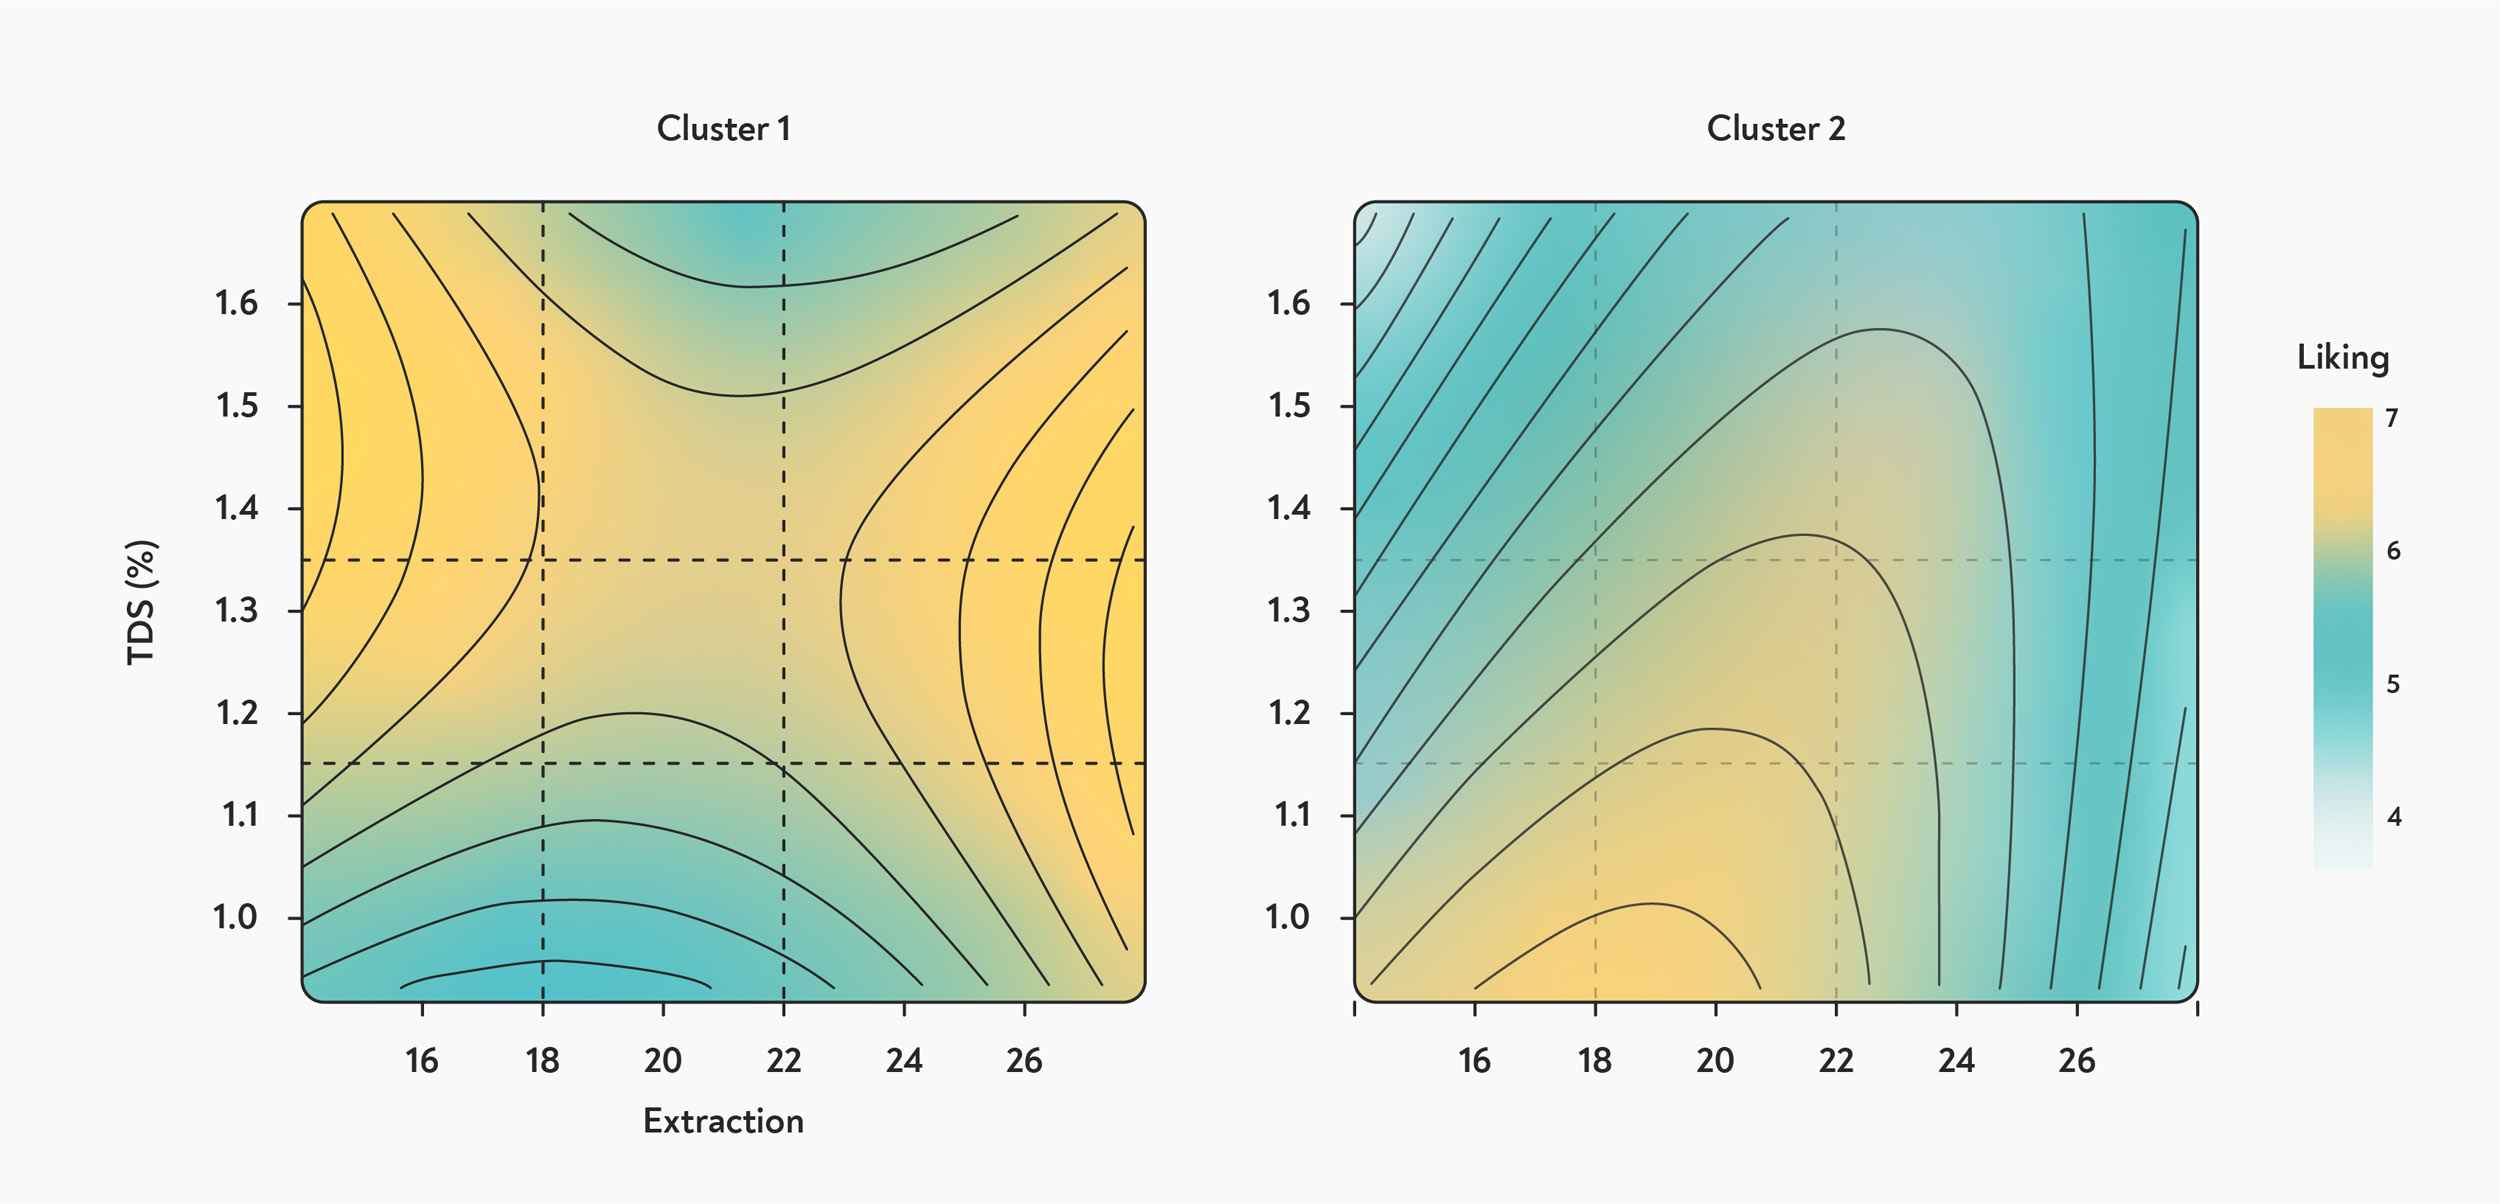 Coffee consumers fall into two groups, based on their preferences. People in Cluster 1 prefer coffees at either extreme of the extraction range, while people in Cluster 2 prefer coffees with a more moderate extraction and low strength. Source: Cotter et al 2020.
While baristas tend to focus on extraction as the primary driver of taste in their coffee, the researchers found that TDS has a bigger effect on the flavour of the coffee, and on consumer preferences, than extraction does. While higher-TDS brews had more intense flavours, acidity, and bitterness, lower-TDS coffees were found to be sweeter.
In a separate paper, they also investigated the interaction of extraction and TDS on the flavours that consumers found in the brews (Frost et al 2020). They found that bitterness and astringency were more closely linked to high TDS than to over extraction, and that the perception of sweetness was highest in low TDS brews. This is quite different to established wisdom about coffee brewing — including the recommendations we make in The Coffee Compass. It’s possible that this difference reflects the different ways that consumers and baristas experience or describe coffee.
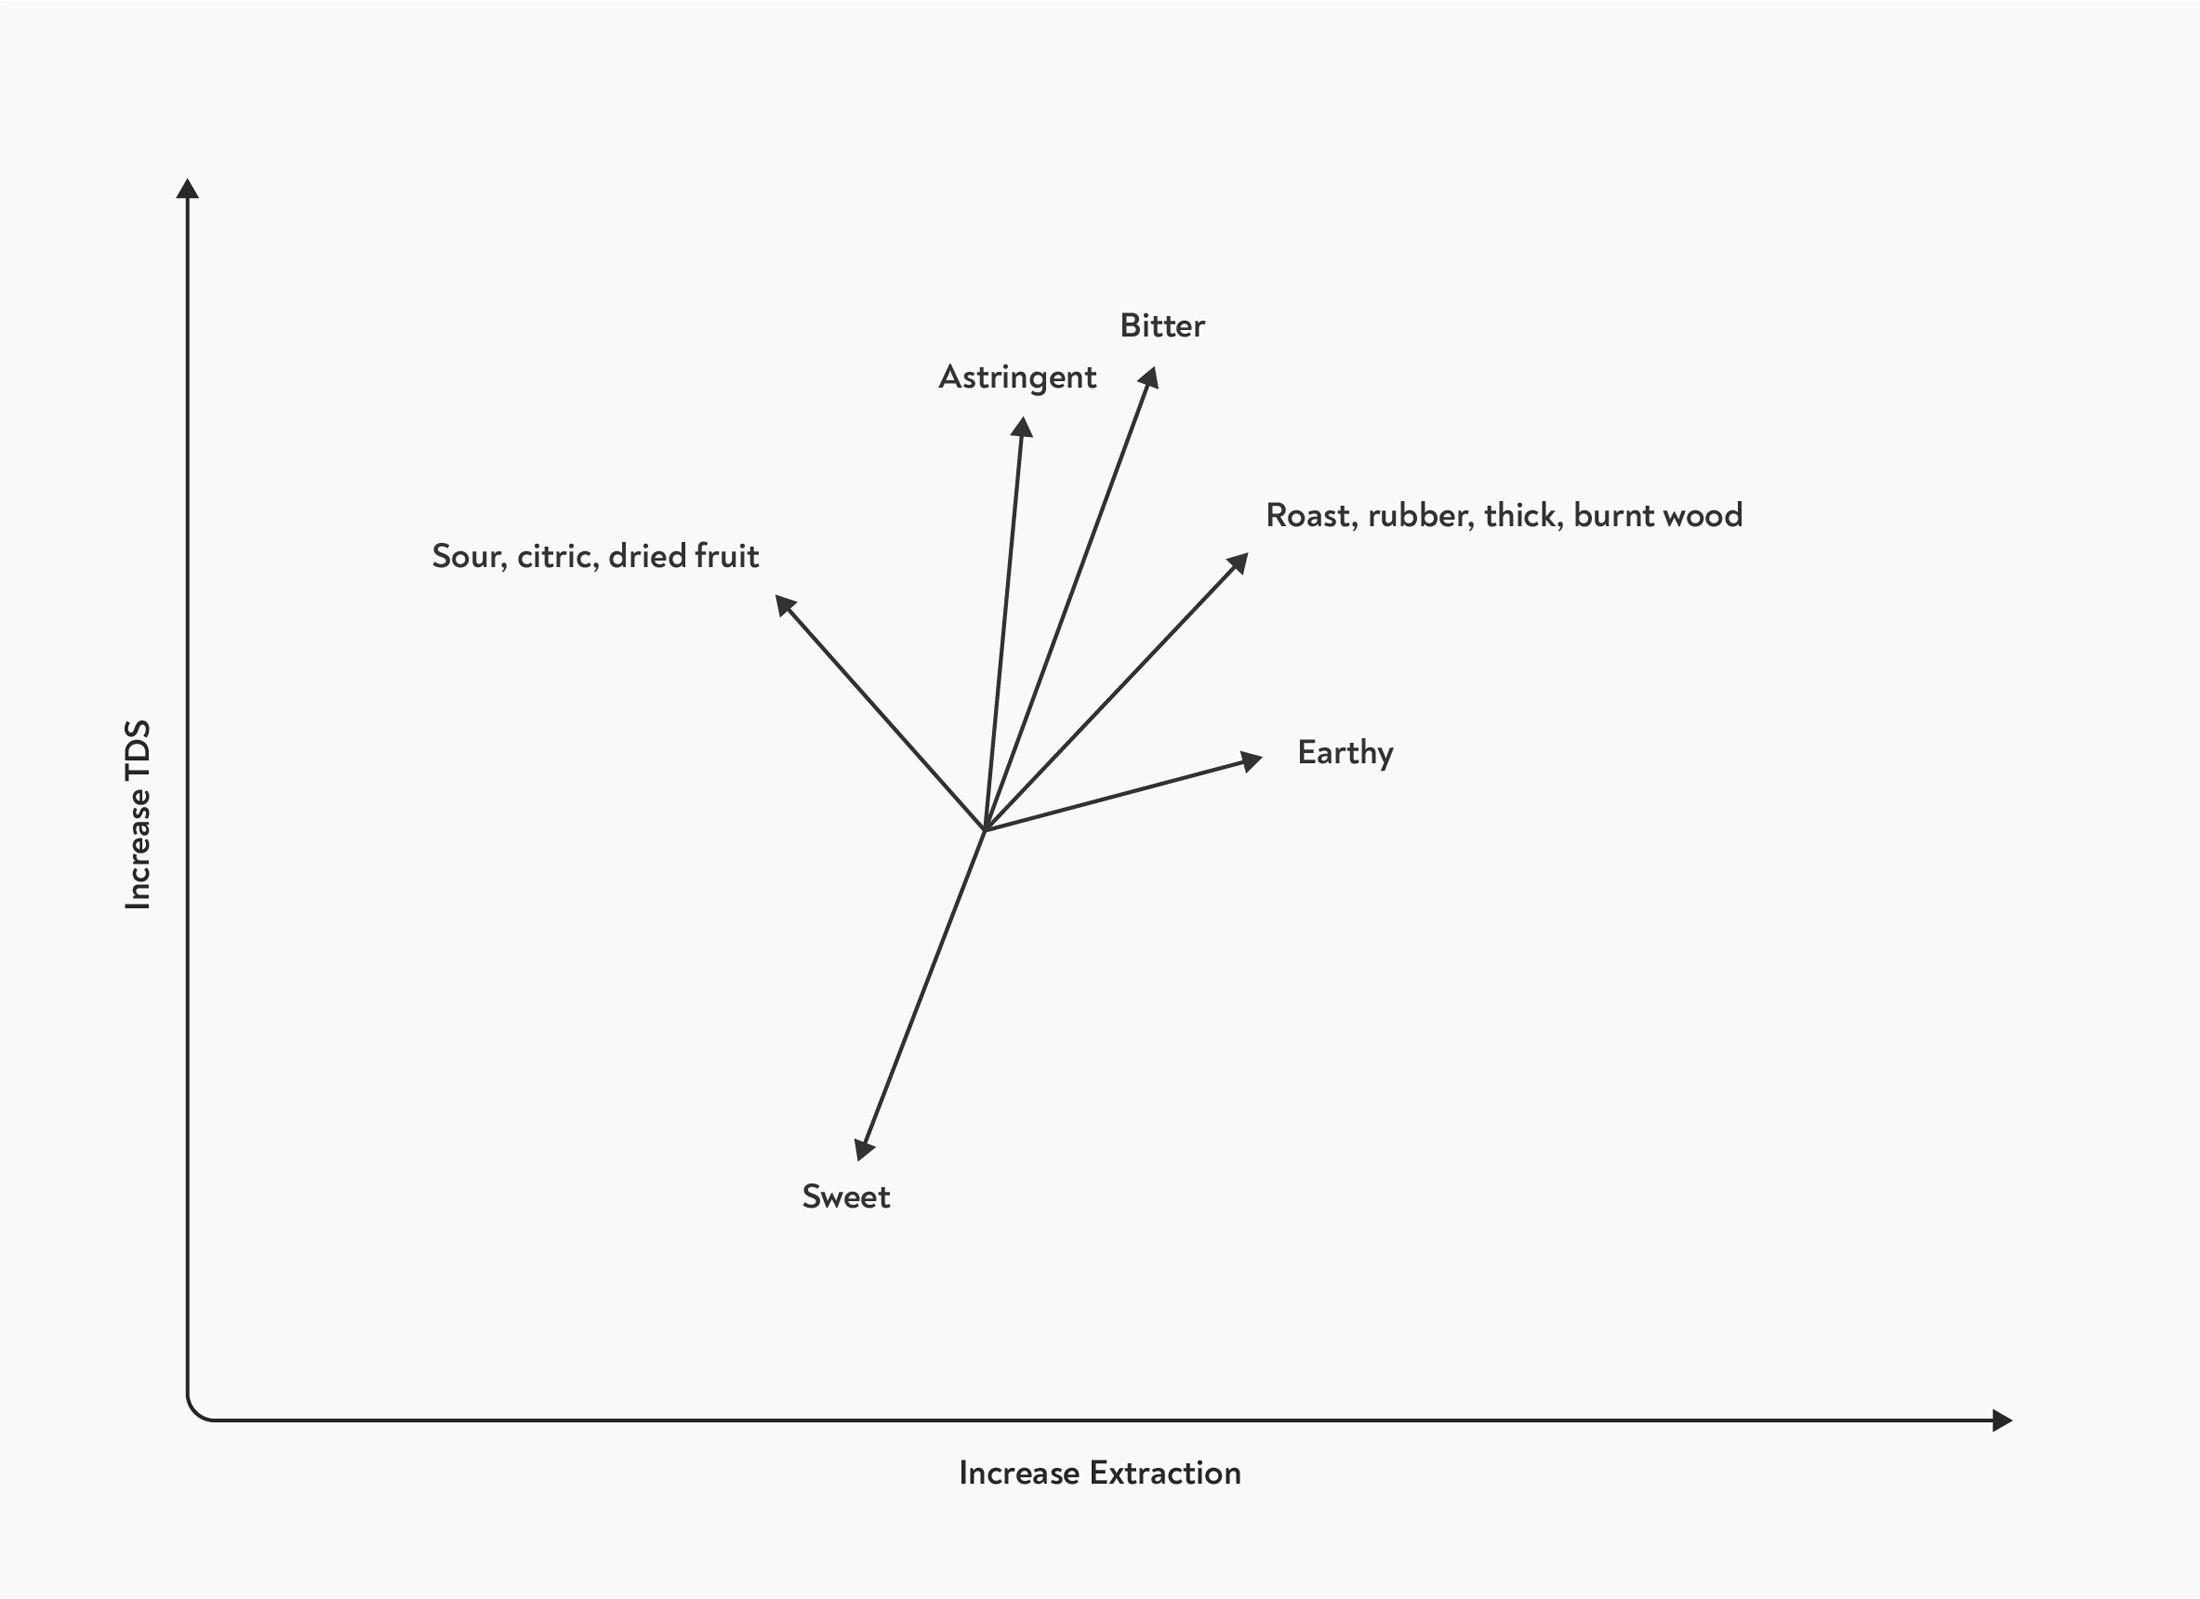 The effect of changes in TDS and extraction on the flavour of brewed coffee, as reported by consumers. Bitterness and astringency are linked to high-TDS brews, while sweetness is linked to low TDS and low extraction. Adapted from Frost et al 2020.
Brewing Methods and Regions
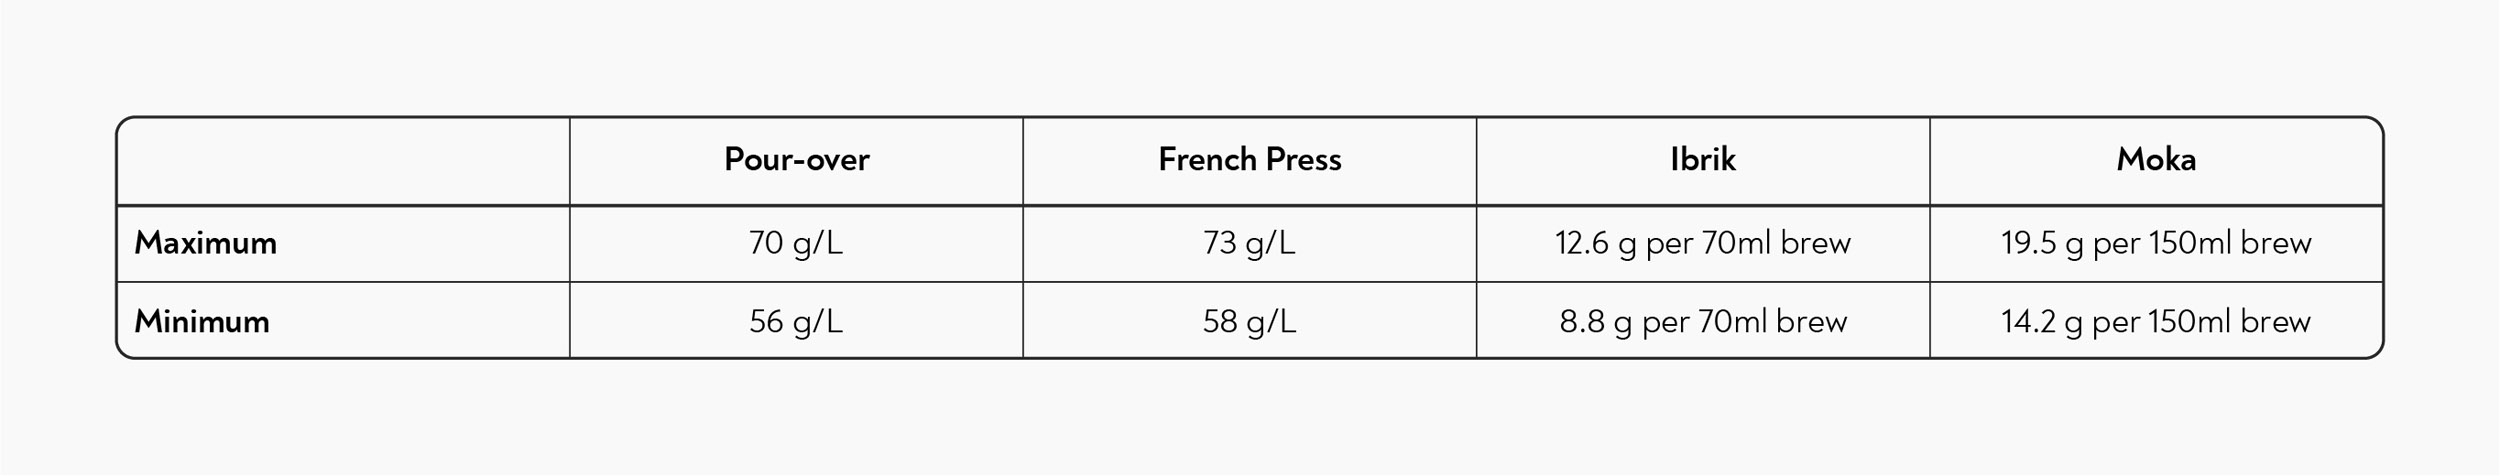
For our own version of the Coffee Control Chart, we wanted to take into account people’s preferences across a variety of brew methods, and in different parts of the world. Our survey (which is still live) has 343 responses so far, mainly representing readers in Europe, North America, and Australasia. The survey asked readers to report the maximum and minimum brew ratios they used for each method. The average amounts of coffee used for each brew method were as follows:
To enable comparison between different methods, we converted these results to an expected TDS, assuming an average extraction of 20% for all methods. We also removed any obvious outliers (shout out to the person using 1.3kg of coffee to make their 1L brews — we hope you’re OK) and compared the results between regions, using pairwise T-tests and one-way ANOVA to check for statistical significance.
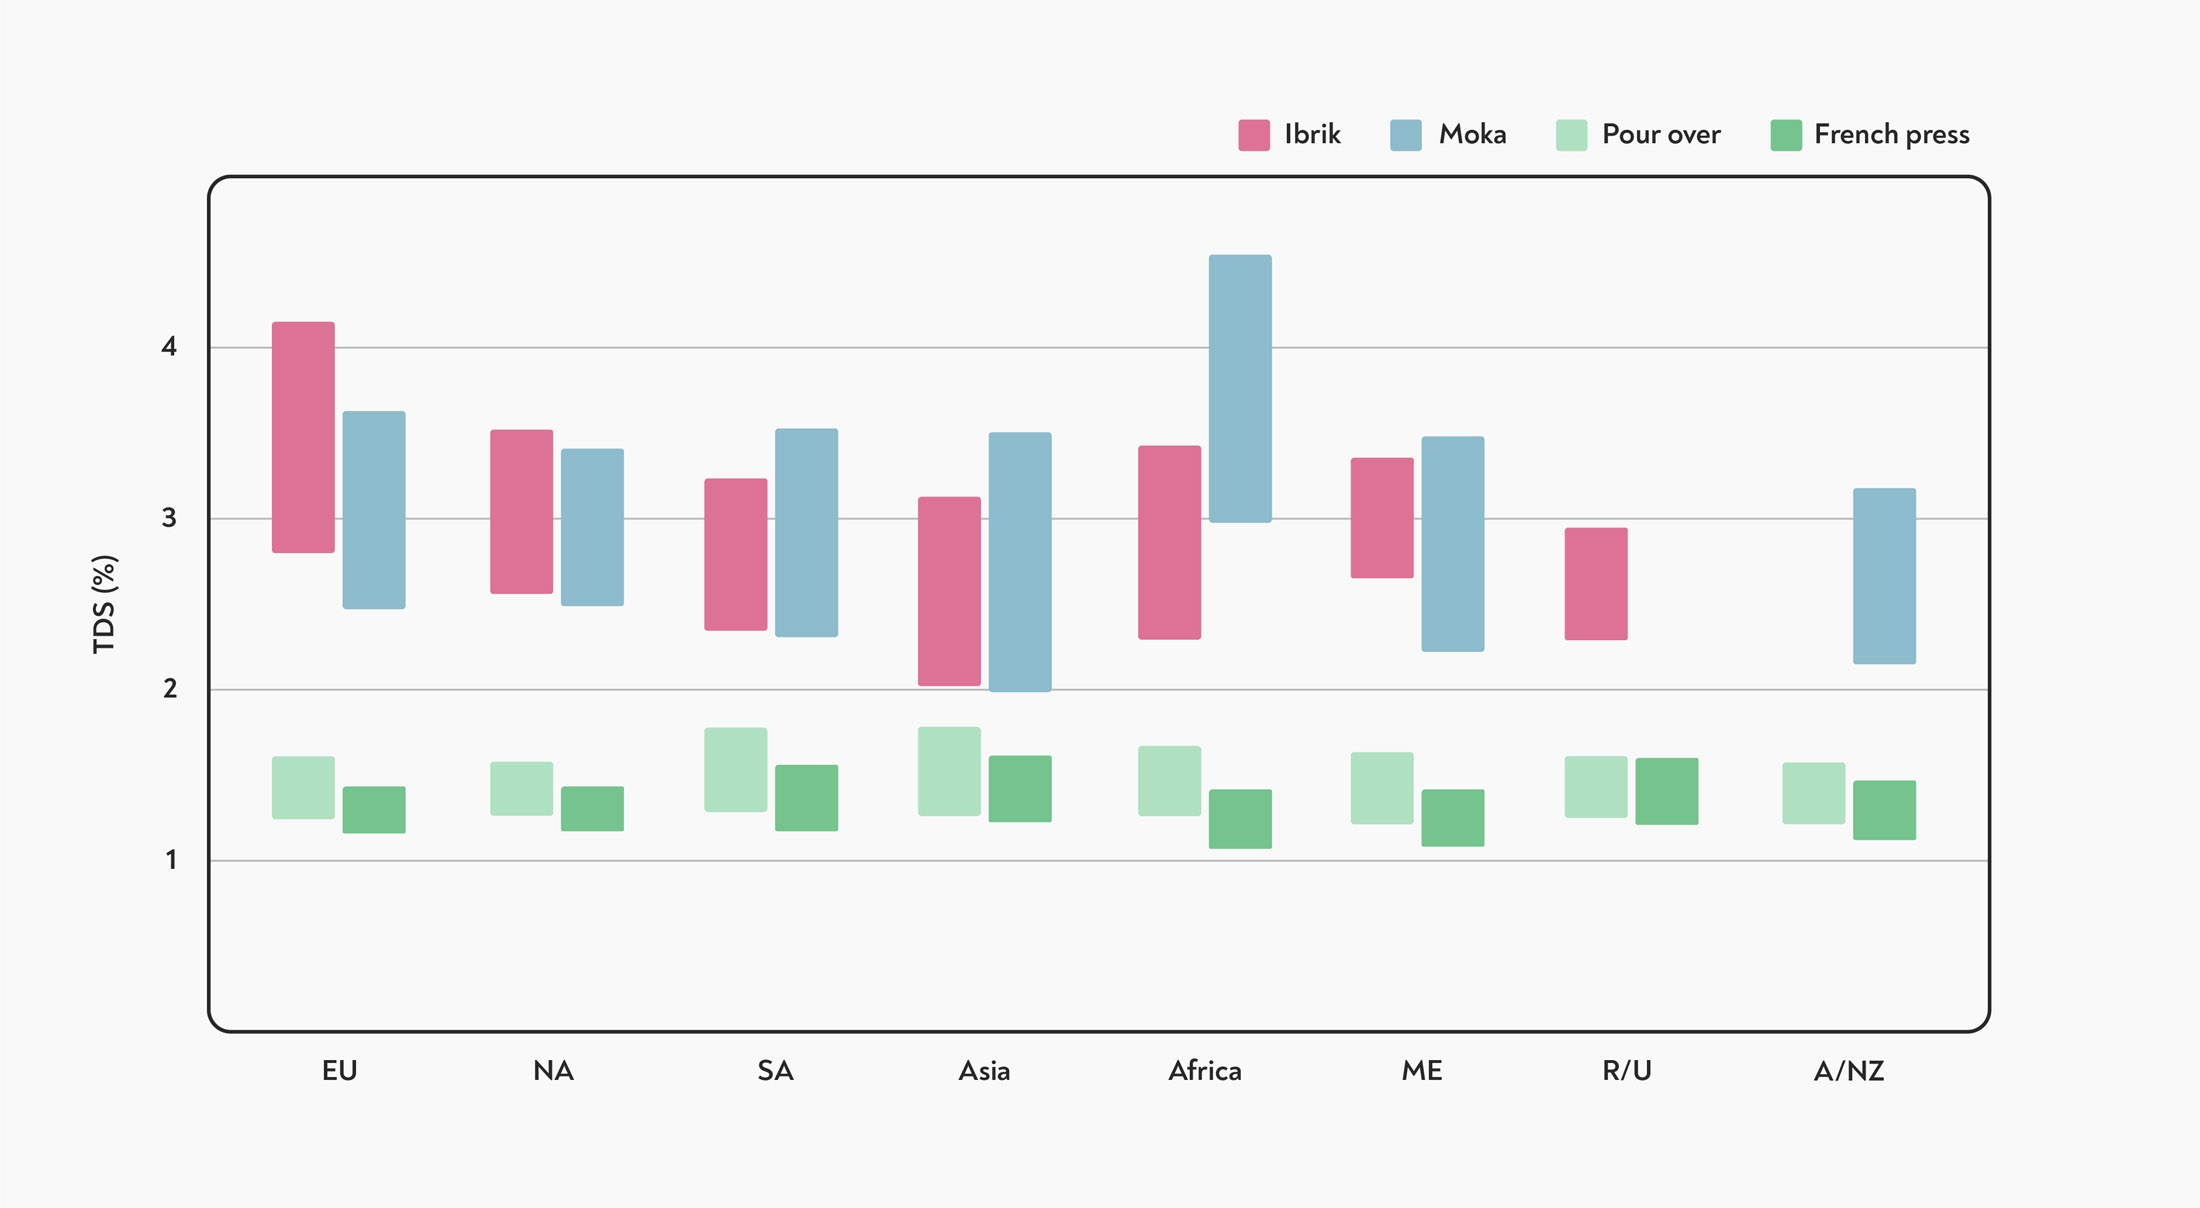 The expected strength from different brewing methods by region, according to our survey. EU = Europe; NA = North America; SA = South and Central America; ME = Middle East; R/U = Russia and Ukraine; A/NZ = Australia and New Zealand.
For drip and immersion brewing methods, the regional differences we found were small. The maximum amount of coffee used was significantly higher for drip coffee in Asia and South America (75 g/L) compared with Europe (69 g/L), North America (68 g/L), and Australasia (68 g/L). Similarly, the maximum amount used for immersion brews in Asia was significantly higher (80 g/L) than in Europe (72 g/L) and North America (71 g/L). The difference in the minimum amount of coffee used from region to region, however, was not significant.
For immersion brews, most people used more coffee than for drip methods — but the difference was not enough to arrive at coffee of the same TDS and extraction. It’s possible that because of the thicker mouthfeel of coffee from a French Press, for example, people target slightly lower TDS in their brews. Alternatively, people might be using lower brew ratios to improve extraction, since immersion is less efficient at extraction. At BH, on the other hand, we normally recommend using more coffee in an immersion (68 g/L, rather than 60g /L) in order to target the same TDS and extraction in the final brew.
For Moka and Ibrik brews, meanwhile, the responses were much more variable — perhaps reflecting the fact that these methods do not have universally agreed-upon brewing standards like the Gold Cup. Because of this variability, and the relatively small number of responses for these brew methods, none of the differences between regions were statistically significant.
Survey Responses Control Chart
The version of the Control Chart below is based on these survey results. It depicts the full range of brew ratios in current use by our readers for different brew methods. Instead of labelling some areas of the chart as ‘strong’ and ‘weak’, the chart highlights where these different brew methods overlap.
 The Coffee Control Chart, according to our survey responses. Brew ratios are given in terms of final beverage weight.
We chose to highlight the range of extraction between 19-24%, in line with the overall consumer preferences reported by Cotter et al (2020), and our own preferences. This also happens to be the same range chosen as ‘ideal’ by Jonathan Gagne in his post about measuring extraction. However, we (and Gagne) don’t automatically consider extractions beyond 24% to be ‘over extracted’ or ‘bitter’ — and bear in mind that what extraction level your customers prefer may vary considerably.
The chart also shows the range of strengths that can be achieved with different brew methods, and shows how different methods can overlap. Rather than being limited by ‘too strong’ or ‘too weak’, the ranges of strengths used probably correspond to the limitations of each brew method — after all, a ‘very strong’ filter coffee would be the same strength as a ‘very weak’ moka pot. New brewing methods are gradually filling in the gaps in the chart — for example, the space between the moka pot and traditional espresso is currently being explored by baristas experimenting with the ‘Allongé’.
The Common Coffee Control Chart
We now plan to build on these survey results to create a Common Coffee Control Chart, that will help readers pin-point the brew ratio that will lead them to the ideal extraction and strength for their brewing method.
To do that, we want to collect more data. We’re opening up the survey to all our readers, and would like to hear about how you brew your coffee. The survey is open to anyone, and no fancy equipment (like refractometers) is required — if you can weigh your coffee, then you can contribute.
Click here to take the survey.
Armed with these survey results, we will be able to build an interactive version of the Coffee Control Chart. The chart will bring all the major brewing methods together in one place, to help baristas explore the full spectrum of extraction and flavour.
In the meantime, we encourage you to go and explore the limits of flavour and extraction. Take a look at the survey results above, and see what parts of the map of extraction and flavour you haven’t experienced yet. Try some brew methods you haven’t used before, or push beyond the traditional boundaries of the brew method you currently use, and let us know what flavours you find.


Question! I’m trying to read that original paper that included the brewing control chart from 1959, but I’m really struggling to find it. Would you be able to redirect me to it by any chance?
Hi barista hustle do you think that is the main reason that dark roast beans extracted in higher ratio for espresso (see italy 14 gr in 50 gr out and here in greece commercial coffees extracted 16in 45 out) lower tds less bitter taste for espresso?
You know Dimitriskapr, it’s interesting that you ask, because for us at BH, we tend to advise folks towards recipes yielding a higher TDS and a lower extraction (more coffee:less water) when a coffee is a really dark roast. The reason for that is that the dark roast will usually be lacking acidity, and be overly bitter. By brewing more in the ristretto style with roasty coffees, you can increase the perceived acidity and possibly reduce the bitterness at the same time.