This video explains how to use the app. For those of you who prefer to read an explanation, we provide the written instructions below.
Prepare Your Grinds
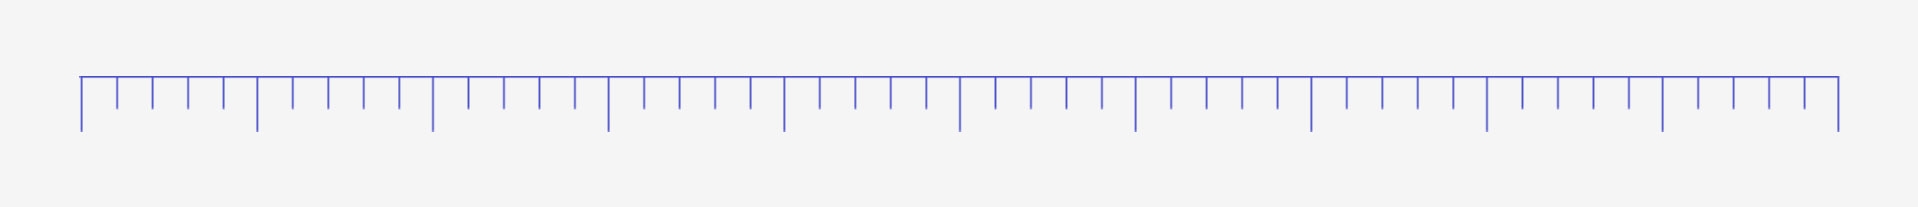
The easiest way to get good results is to use a backlight — this maximises the contrast between the grinds and the background. To do this, you can simply use an iPad, or a laptop screen placed horizontally. Load up this webpage and display it full screen: this provides a white background and a scale that you can use to calibrate the size of the image.
Next, spread the grinds onto the background in such a way that as many particles as possible are in the image but none of them are touching each other. The easiest way to do this seems to be to sprinkle the grinds using finger and thumb. Any particles that are touching after this can be moved apart with the tip of a chopstick, or bigger clumps can be picked up and sprinkled again. Whatever method is used, it’s important that all particles you pick up are returned onto the background, to avoid preferentially removing particles of a particular size.
Take a Picture
‘With coffee grind analysis, as with everything else, it’s garbage in, garbage out’, Professor Abbott points out. Getting a good picture in the first place will make finding the correct settings for later analysis considerably easier. For best results, use a camera with any automation settings (for example, white التوازن and auto focus) turned off.
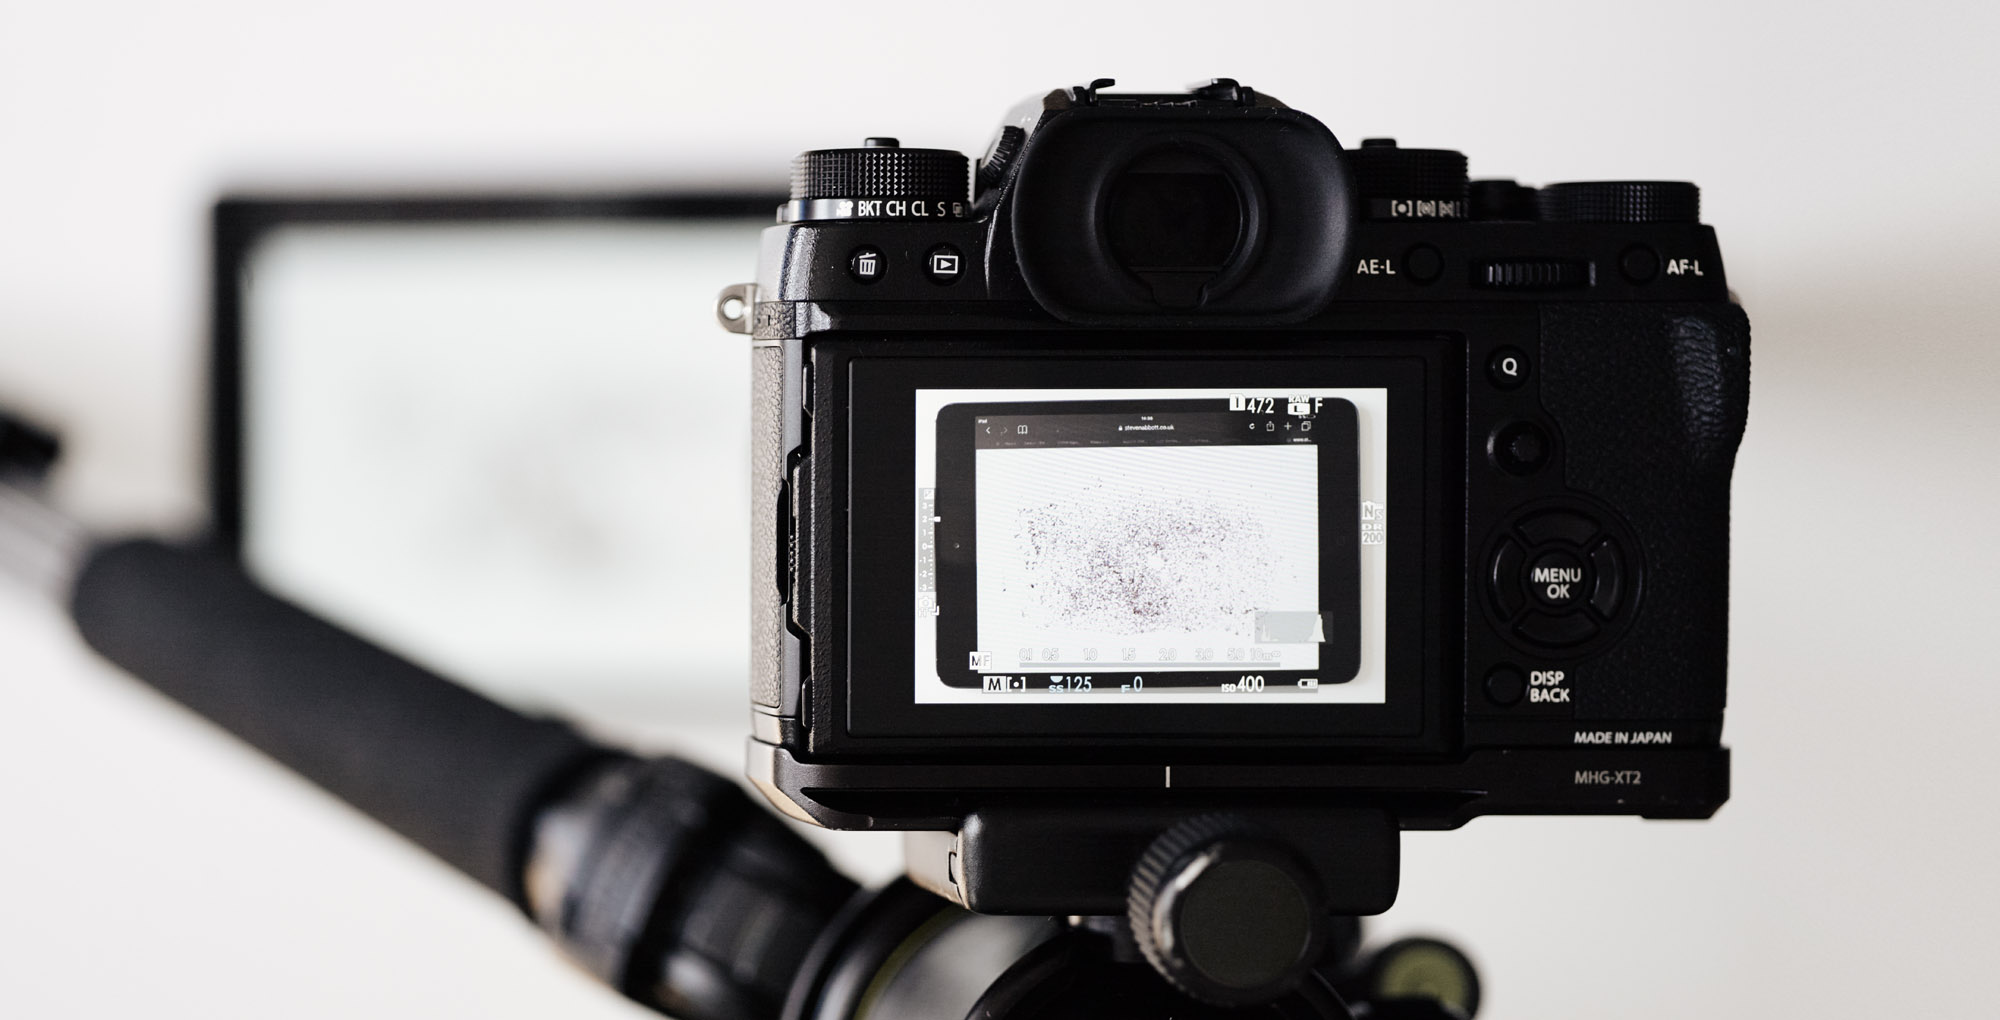 Taking a photo of your grinds displayed on the scale page using an ipad screen as a back light.
Position the camera as perpendicular to the image as possible, ideally using a tripod with a spirit level to hold it steady and square. Focus the image carefully, and use the highest resolution available to you.
Then measure the full length of the ‘scale’ displayed in your image using a ruler and record the number in millimetres. You need this number to calibrate the ‘width mm’ setting in the app. The size of the scale displayed in your backdrop will depend on your screen size and resolution so the ruler is needed to teach the app what the real width of the image is.
Upload and Calibrate the Image
Head to the application page and click on ‘load Image’ in the app to upload your image. Start in ‘Pic Only’ mode (ensure that the ‘Pic only’ check box is ticked), which means the full image is displayed and the results are not yet shown. In this mode, adjust the width slider on the top right side of the page.
 A gif showing you how to change the threshold values in the app
Next, calibrate the threshold value. Again, in ‘Pic Only’ mode, hover the mouse over a few different areas of the background and over some coffee grinds, and note the values shown in the box marked ‘x,y,(rgbk), click drag for mm’. The first two values are the XY position of the cursor, while the last four values show the RGBK values for that position. (These numbers represent the brightness of each colour at that point.) For example, when hovering over an area of white background, the following numbers are displayed: 197, 19, 156, 158, 157, 157. This means, at the coordinate 197 ✕ 19, the RGBK values are 156, 158, 157, 157. When hovering over a coffee grain, the display shows RGB values of 10, 9, 8, 9. Therefore, a good threshold number to differentiate between the grains and the background will be within 10 and 157. The ideal threshold number is high enough to include all the particles in the image but low enough to exclude lighter artefacts, such as the scale, shadows, or blurs. To check if a particular object has been excluded by the threshold, untick the ‘Pic Only’ check box and confirm that it is no longer visible. If it is still visible, choose a lower threshold number until it disappears.
If you have a good-quality image, the remaining settings can be left as default and you can move straight onto the analysis. However, for advanced users or to compensate for less good picture quality, you can adjust these settings:
Min-Pixels – If you have a ‘noisy’ image, with lots of 1–2 pixel dots, set a Min-Pixels value of, say, 5, so that this noise is ignored. Of course, this might exclude some real grains, so you need to reach a compromise value.
Max-Pixels – The Max-Pixels value excludes the largest dots from the image. This value can often be set to a medium value in order to exclude occurrences such as two large grains touching each other, the scale marks, or a bit of black edge that appeared in the image. Set it too small and some real grains are excluded. Too large, and some bit of junk will be included and generally reduce the worth of the calculations. The correct setting in this case is a matter of judgement, and it requires some trial and error.
N-bins – To analyze the sizes, it is customary to place them into ‘bins’. Everything from 0.0–0.1 mm might be in one bin, everything from 0.1–0.2 mm in another, etc. N-Bins lets you choose how many bins are used. Too few, and you don’t get a sensible analysis. Too many, and you probably don’t have enough grains per bin for the data to make statistical sense. Look at the graphs generated in the app and move the slider accordingly until a clear trend is visible.
D-x – This final setting is optional and tells you what size ‘most’ (as a percentage) of the grounds fall under. For example, if you set it to 90, then the app tells you the size below which 90% of the particles are found.
To establish whether you’ve chosen good calibration values, take a look at the values in the box marked ‘NGrounds, Max’. This shows the number of particles included in the analysis and the size of the largest particle included. If you change Threshold or Min-Max Pixels over a reasonable range and if these values remain not much changed, then you are in a happy part of image analysis space where your measurements are way above any noise level from junk in the image. If the numbers change a lot, then your final results depend on your judgment rather than hard numbers. The more time you devote to getting well-lit images with few artefacts, the less you will need to fiddle with the control variables.
Analyse the image
Once you’re happy with your calibration settings, it’s time to analyse the image. Untick the ‘Pic Only’ check box, and the image will change to show you only the particles the app is including in the analysis. Below the image will appear your توزيع حجم الطحن.
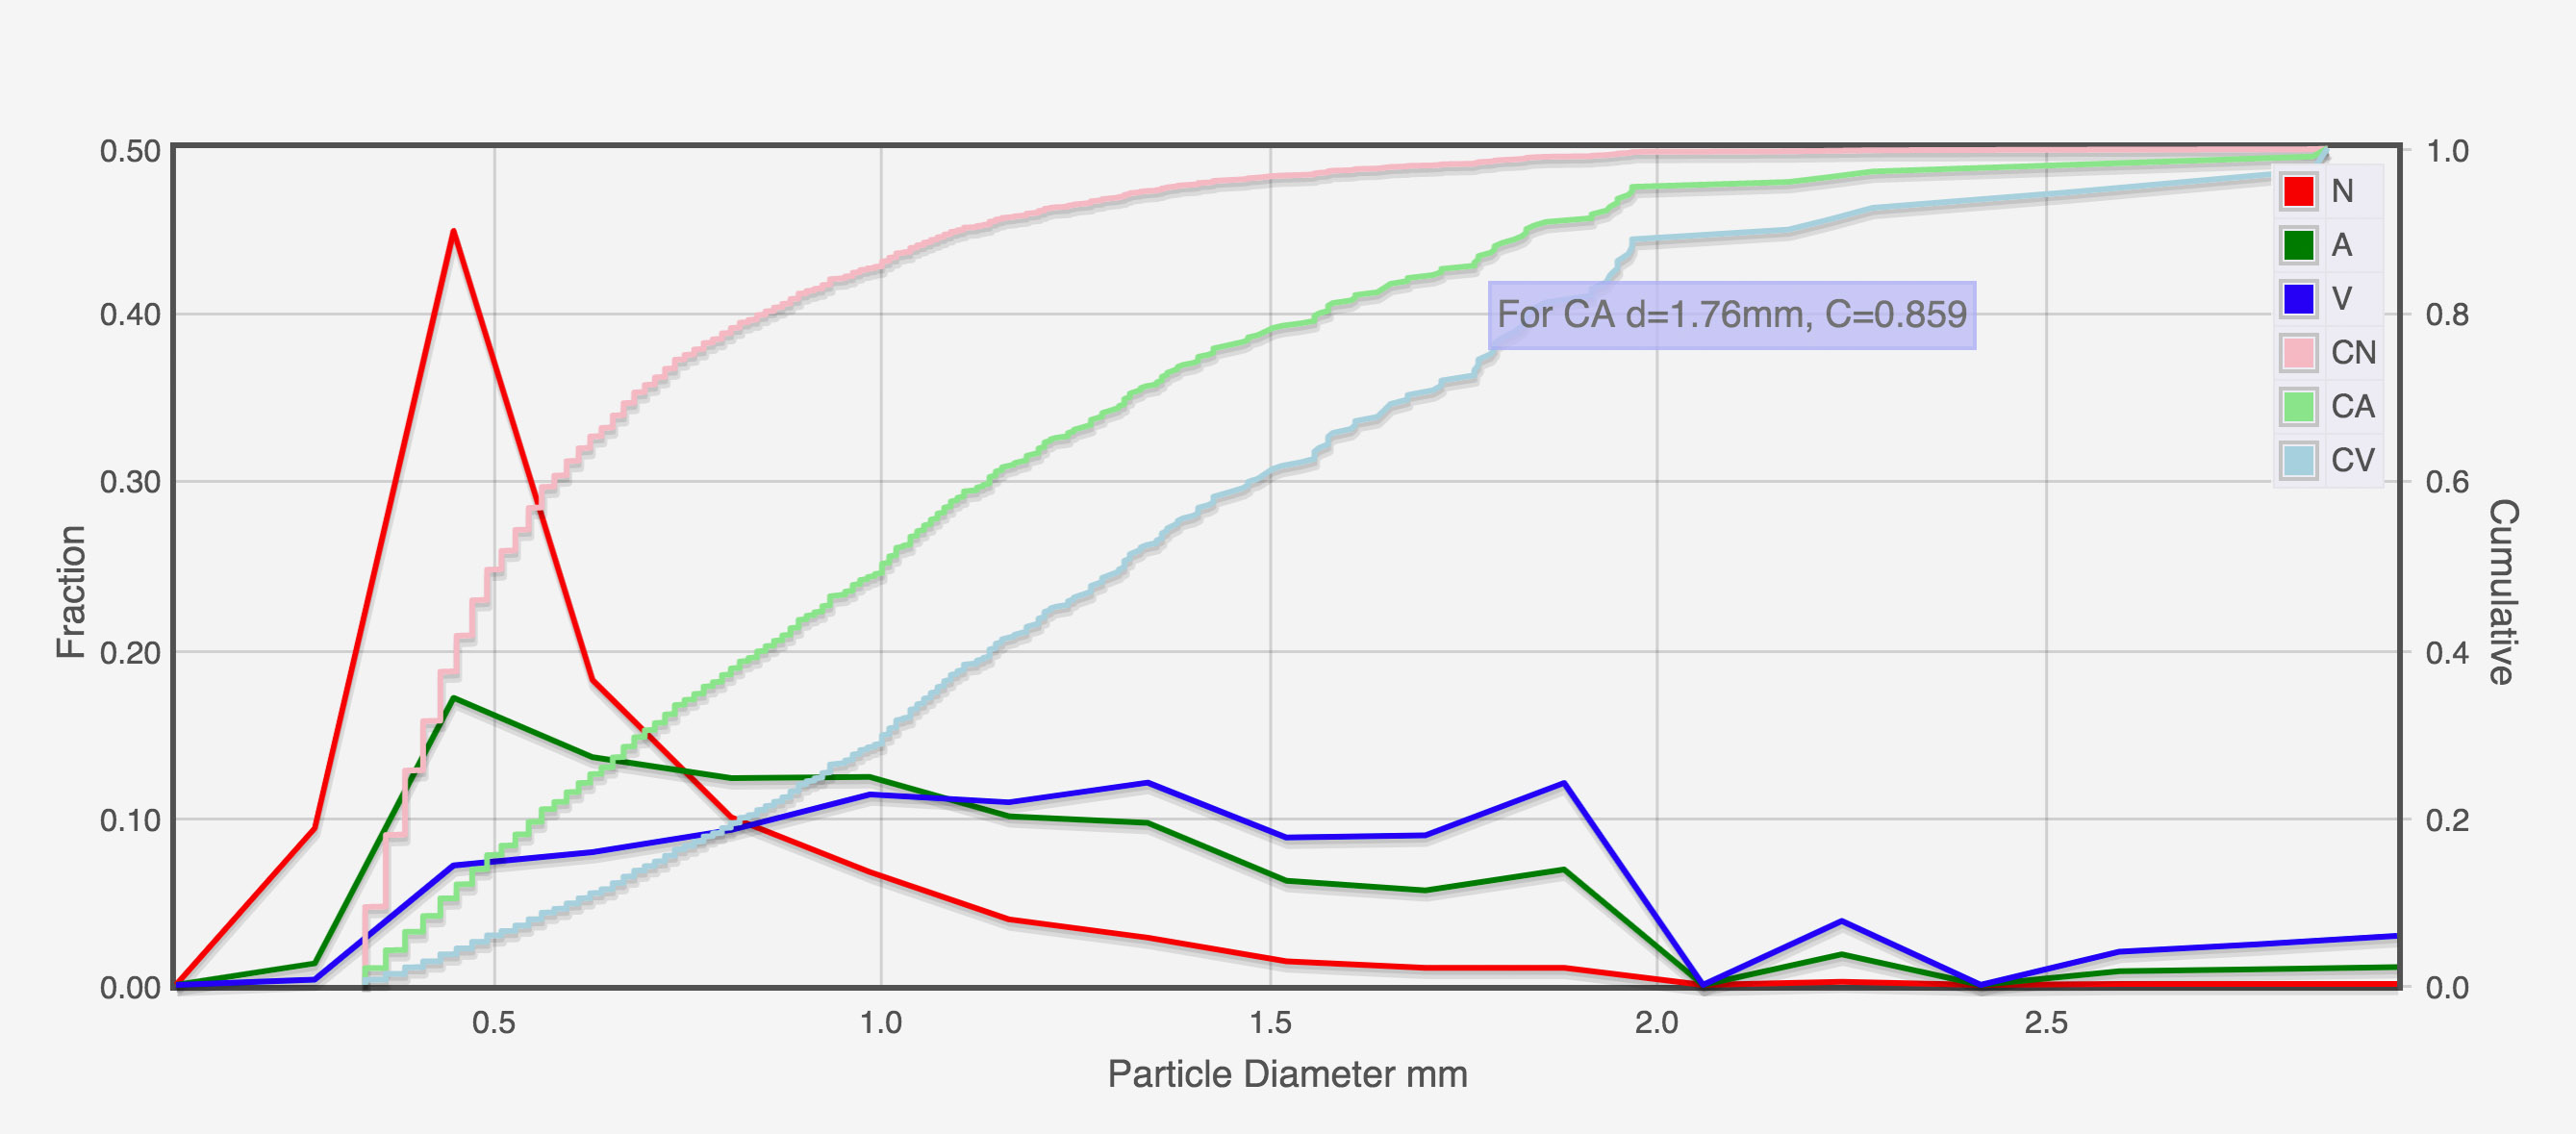
To see the distribution as a logarithmic plot, which is the way distributions are commonly displayed, tick the ‘Log Plot’ check box. This gives more resolution to the smaller particle sizes but makes the scale less intuitive to read.
The chart then shows six lines: the particle count (‘N’) in red, shows the raw number of particles at each grind size. The lighter red line shows the cumulative number of particles, so you can easily see the percentage falling below a certain size. The two lines in green (‘A’), show the estimated surface area contribution from each size of particle. Again, the light green line shows the cumulative contribution to surface area. Finally the blue lines (‘V’) show the volume contribution from each size, and the cumulative volume appear in light blue.
The box above the chart marked ‘N, A, V, D-x mm’ also gives some additional information: the mean particle size values by number, area, and volume of particles, followed by the D-x value, the size below which x% of particles are found.
Limitations to Consider
Two main limitations may cause your measurements to be imperfect: the amount of coffee particles that fit in one picture and the resolution of your camera. The number of particles you can measure will limit how accurate your particle size distribution can be. The camera resolution will determine the smallest particles that the application can detect. ‘With a typical iPhone camera, picture set-up and the default software settings, you won’t see any particle smaller than about 0.2 millimetres (or 200 microns) in diameter.’ Jonathan Gagné explains. ‘It is surely possible to go a bit smaller by taking a close-up picture, but then you will have a very small amount of particles in the picture.’ To compensate for this, he suggests conducting a parallel analysis with a 200-micron sieve to establish what proportion of the particles are this size or below.
نهاية 1.05